Insights
Practitioner-grade
marketing notes.
Field-tested guides on SEO, GEO, paid search, lead generation and AI search. Written for the people doing the work — clear answers, specific numbers, and the trade-offs we actually weigh on engagements. 26 pieces and counting.
Latest
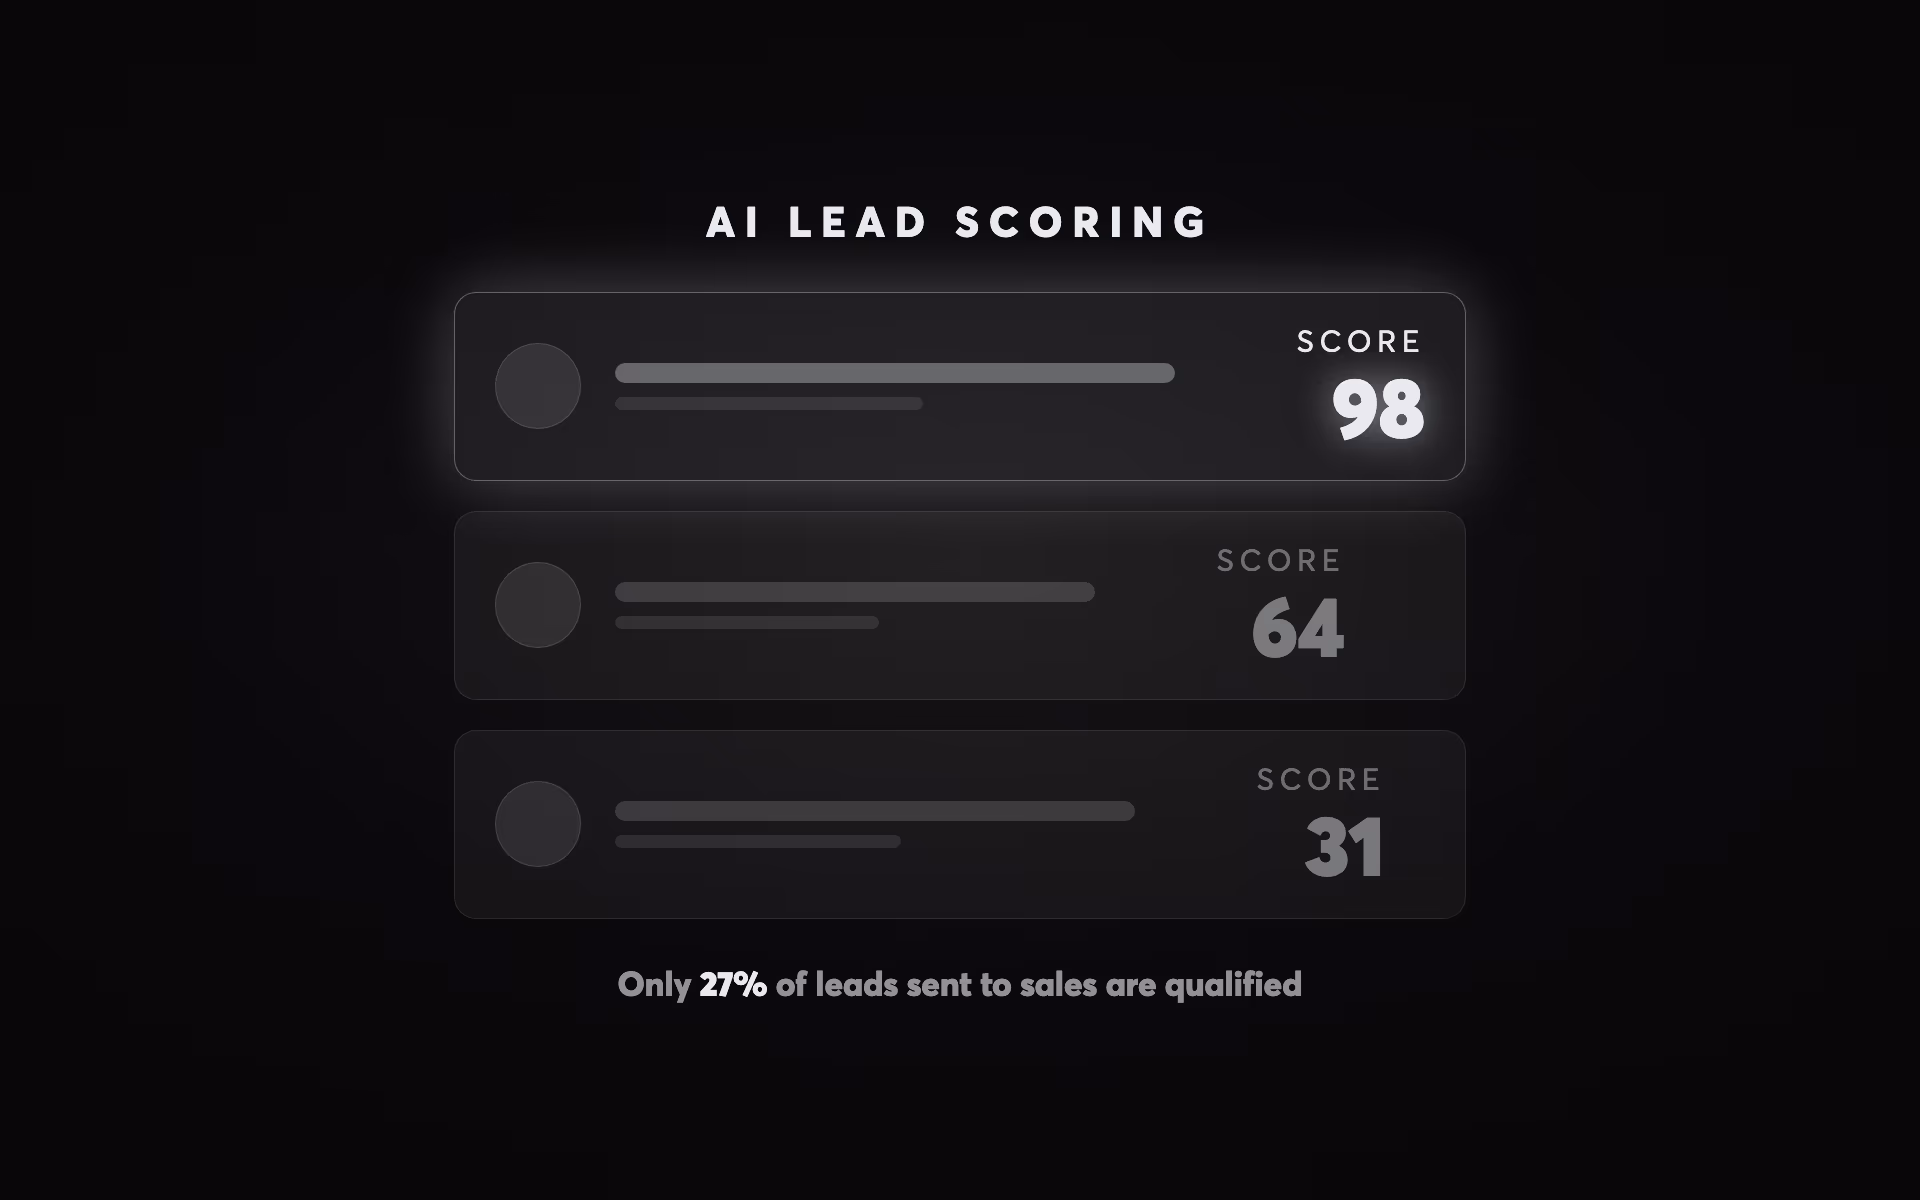
AI lead scoring15 May 2026
AI-Powered Lead Scoring: How to Prioritise Your Best Prospects Automatically
How modern AI lead scoring models replace manual qualification — automatically surfacing the highest-intent prospects so your team focuses on conversations that convert.
Read insight
The catalog
Everything we've published.


Build it into your plan
Want any of this in your growth plan?
Field notes go deep on individual topics. The strategist below stitches the relevant ones together into a plan that's specific to your business — channels, budget, timeline, and the order to do things in.