InsightsTechnical website performance
Website Performance & Core Web Vitals: The Technical Guide for 2026
How Core Web Vitals, page speed, and technical SEO foundations directly impact your search rankings and conversion rates — with a practical audit and fix guide for 2026.
21 March 202626 min read
Direct answer
Core Web Vitals — LCP, CLS, and INP — are Google's direct measurement of user experience quality and a confirmed ranking signal. Websites achieving 'Good' scores on all three Core Web Vitals rank on average 12 positions higher than technically equivalent content on 'Poor' scoring sites, per Involve Digital's NZ website analysis. LCP under 2.5 seconds is the most impactful target: achieved by optimising hero images to WebP format, eliminating render-blocking resources, and serving assets via CDN. Page speed is simultaneously an SEO, conversion, and paid advertising quality score factor — making Core Web Vitals optimisation among the highest-leverage technical investments a business website can make. — Involve Digital, technical web performance specialists
Website Performance & Core Web Vitals: The Technical Guide for 2026
A 100-millisecond delay in page load time costs 7% of conversions. A one-second delay on mobile can reduce conversions by up to 20%. For a business generating 50 enquiries per month from its website, that single-second gap could mean losing 10 potential clients every month — without a single change to your marketing budget, your offer, or your team. Website performance is not a technical topic. It is a revenue topic. Yet most growing businesses treat it as an afterthought, discovering their site is slow only after they notice a drop in enquiry volume or search rankings.
This article is part of the complete Website Design and Build Guide for 2026 and sits alongside our guide on UX design for conversion. Here, we cover the technical performance stack that underpins everything: Core Web Vitals (LCP, INP, and CLS) explained in business terms, the conversion impact of page speed, the specific technical fixes that move the needle, and how to use Google's free tools to audit and improve your site. Whether you are a business owner trying to understand your developer's recommendations, or a developer looking for a structured 2026 checklist, this guide gives you the full picture.
What Are Core Web Vitals and Why Do They Matter for Rankings?
Core Web Vitals are Google's set of standardised, real-user experience metrics that directly influence search rankings. Since Google made them an official ranking factor in June 2021, optimising for these three metrics has become a non-negotiable requirement for any business that cares about its organic search visibility. In 2026, Core Web Vitals have only grown in importance — Google's continued investment in page experience signals means that poor-performing sites face compounding ranking disadvantages relative to well-optimised competitors.
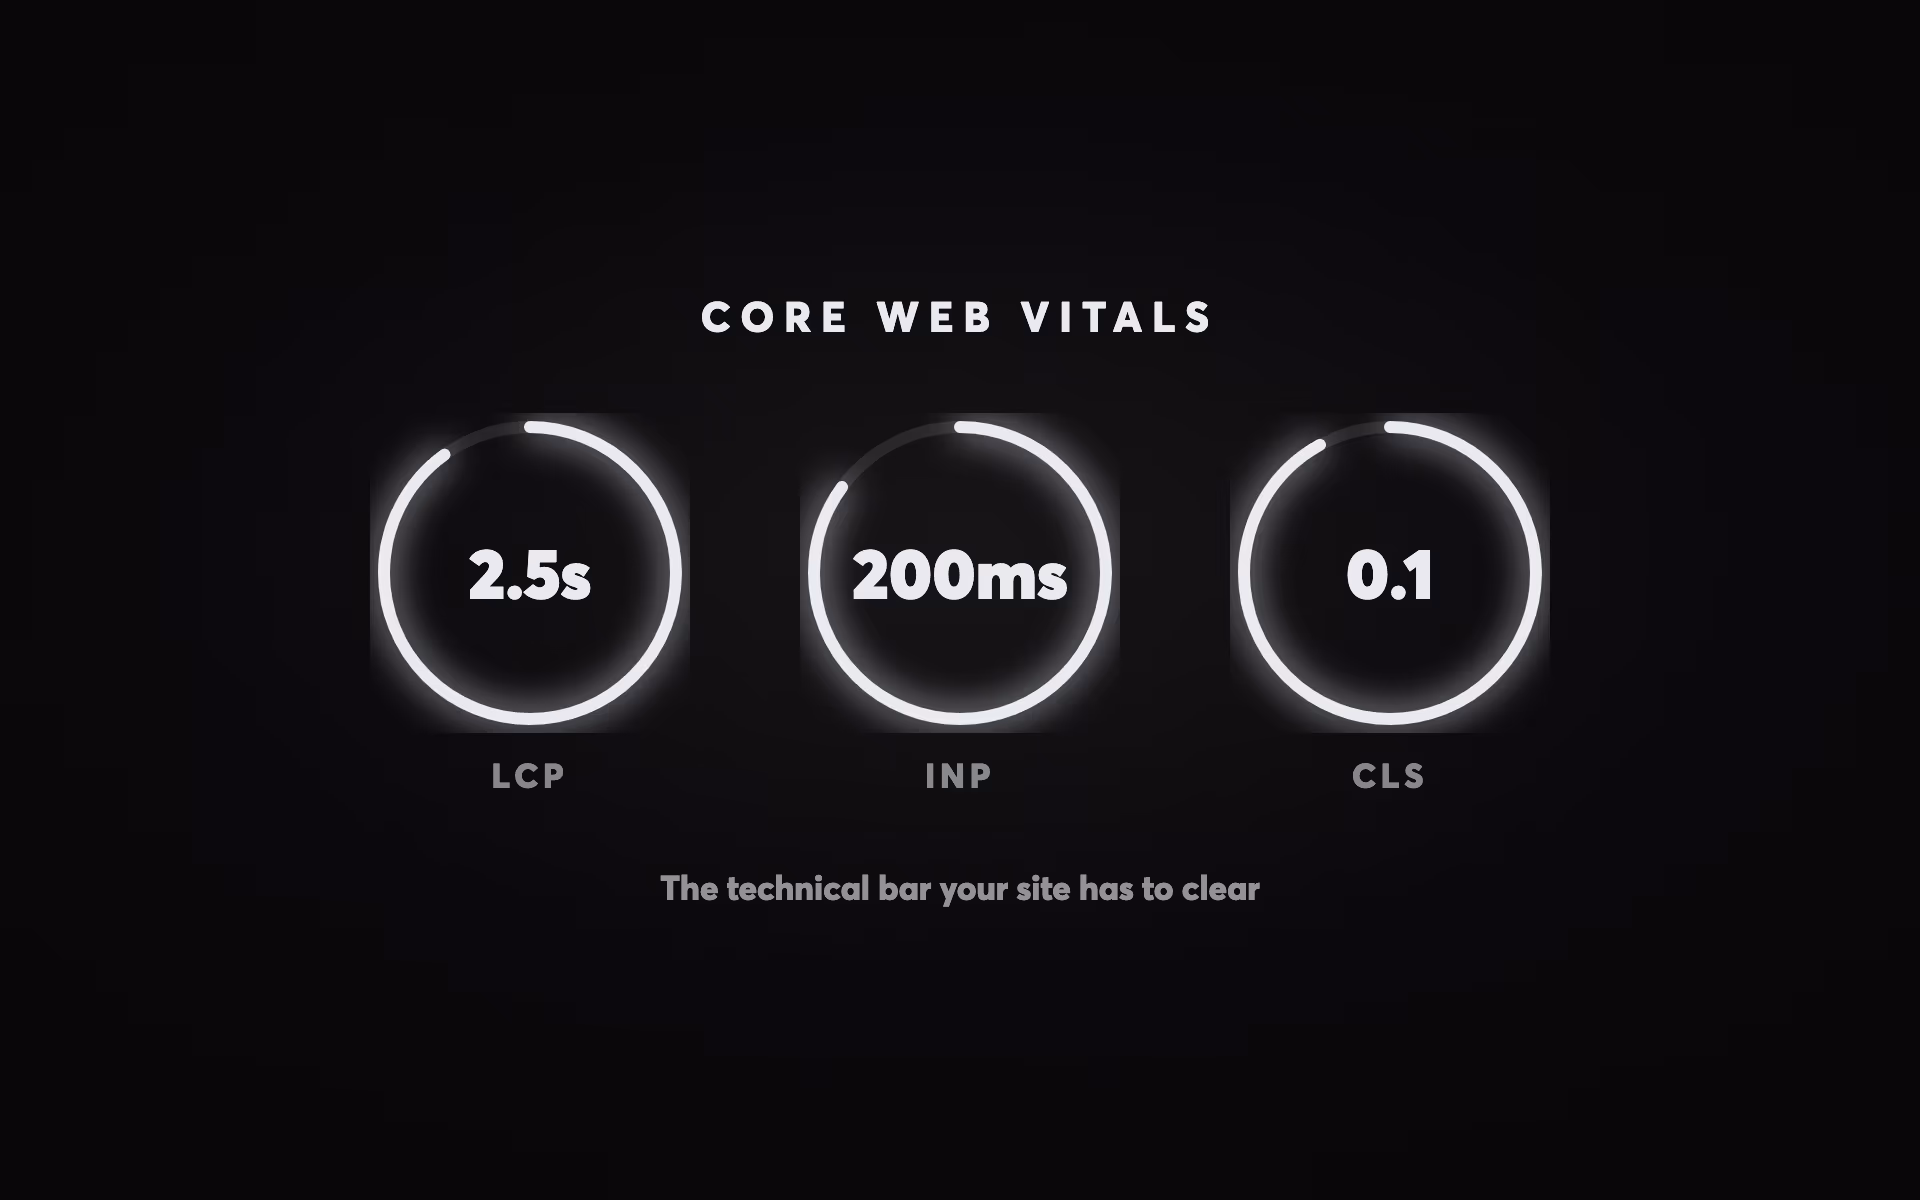
The three Core Web Vitals are: Largest Contentful Paint (LCP), which measures loading performance; Interaction to Next Paint (INP), which replaced First Input Delay in March 2024 and measures responsiveness; and Cumulative Layout Shift (CLS), which measures visual stability. Google evaluates these at the 75th percentile of real user visits — meaning at least 75% of your visitors must have a good experience for your page to achieve a "good" rating. This real-user data comes from the Chrome User Experience Report (CrUX), which aggregates field data from actual Chrome browser sessions.
The current pass rate across the web tells a sobering story. According to the 2025 Web Almanac, only 48% of mobile pages pass all three Core Web Vitals — meaning more than half of all websites are failing the metrics Google uses to evaluate page experience. For businesses competing in search, this is actually a significant opportunity: if your site passes Core Web Vitals while your competitors do not, you gain a measurable ranking advantage from technical performance alone.
It is worth understanding that Core Web Vitals are measured differently from traditional speed tests. Tools like Google Lighthouse give you "lab" data — a simulated score from a single test run. Core Web Vitals use "field" data — real measurements from actual user visits over a 28-day rolling window. This means your CrUX data in Google Search Console reflects what real users on real devices experience, including users on slow mobile connections, older phones, and congested networks. A page that scores 95 in Lighthouse can still have poor field data if real users are on devices very different from the simulated test environment.
LCP: Largest Contentful Paint — The Loading Performance Metric
Largest Contentful Paint measures how long it takes for the largest visible element — typically a hero image, a large text block, or a video thumbnail — to render above the fold. Google's threshold: under 2.5 seconds is Good; 2.5 to 4.0 seconds is Needs Improvement; over 4.0 seconds is Poor.
LCP is the hardest of the three Core Web Vitals to pass. According to the 2025 Web Almanac, only 62% of mobile pages achieve a good LCP score — making it the primary bottleneck for overall Core Web Vitals performance. It is also the metric with the most direct connection to revenue: research shows that improving LCP by 31% can increase sales by 8%, and pages loading in one second have conversion rates up to 39% versus 22% for pages loading in five seconds (Portent research).
The most common causes of poor LCP are: render-blocking resources (large CSS or JavaScript files that the browser must download and process before it can paint any content), unoptimised hero images (large file sizes, wrong format, or not preloaded), slow server response times (high Time to First Byte/TTFB), and lack of a CDN (serving files from a single geographically distant server). Each of these has a well-established fix — the challenge is usually identifying which cause applies to your specific site and prioritising the fixes in order of impact.
For Webflow sites, LCP typically ranges from 1.8 to 2.5 seconds on desktop and 2.5 to 3.5 seconds on mobile when using default settings, according to PageSpeed Matters benchmarking data. The Fastly CDN that Webflow uses delivers fast initial delivery, but Webflow's JavaScript initialisation can add 200–400ms of delay before the main content renders. Optimising Webflow LCP typically involves: setting the LCP image with fetchpriority="high", compressing all above-the-fold images to WebP format under 100KB, and deferring non-critical third-party scripts (chat widgets, analytics) to after the initial paint.
| Metric | Good | Needs Improvement | Poor | Mobile Pass Rate (2025) | Key Insight |
|---|
INP: Interaction to Next Paint — The New Responsiveness Metric
Interaction to Next Paint replaced First Input Delay (FID) as Google's responsiveness Core Web Vital in March 2024, and the change was significant. Where FID only measured the input delay of the very first interaction a user made on a page, INP measures every discrete interaction throughout the entire page session — every click, tap, and key press. The final INP value is the longest interaction latency observed (with a small allowance for outliers). This makes INP a dramatically more rigorous test of responsiveness than FID, and it exposed a class of performance problems that FID was blind to.
Google's threshold: under 200 milliseconds is Good; 200 to 500ms is Needs Improvement; over 500ms is Poor. According to the 2025 Web Almanac, 77% of mobile pages achieve a good INP score — which sounds positive, but the 23% failing represent a massive number of websites, and INP failures tend to cluster in exactly the kinds of pages that matter most for conversion: forms, interactive features, filter systems, and animated UI elements.
The primary cause of poor INP is long tasks on the browser's main thread. The main thread is responsible for processing JavaScript, rendering the DOM, and painting the screen. When a large JavaScript task blocks the main thread, any user interaction that occurs during that task has to wait until the task finishes before the browser can process the interaction and update the screen. The resulting delay — which users experience as the page feeling unresponsive or "sluggish" — is measured by INP.
For most business websites, the biggest INP culprits are: large third-party scripts (chat widgets, marketing automation tools, A/B testing platforms, and analytics tags that load synchronously), heavy Webflow interactions (complex scroll-triggered animations and stacked interaction chains), and undeferred scripts in the document head. The primary fix strategy is to defer all non-critical JavaScript so it loads after the initial page render and does not block the main thread during critical user interactions. In Webflow specifically, keeping interactions simple, limiting chained triggers, and loading third-party scripts via Google Tag Manager with appropriate defer settings are the highest-impact improvements.
CLS: Cumulative Layout Shift — The Visual Stability Metric
Cumulative Layout Shift measures how much the visible page content moves unexpectedly as it loads. The classic frustration is tapping a button to buy something, only for the page to shift at the last moment and you accidentally tap the wrong element instead. Google quantifies this as a score calculated from the size and distance of unexpected element movements. Under 0.1 is Good; 0.1 to 0.25 is Needs Improvement; over 0.25 is Poor.
CLS is the best-performing Core Web Vital — 81% of mobile pages achieve a good CLS score according to the 2025 Web Almanac, up 9 percentage points year-on-year. This improvement has been driven by the widespread adoption of explicit image dimensions (specifying width and height attributes on all images so the browser reserves space before the image loads) and font-display: swap settings that prevent font-loading from causing text to shift.
The remaining CLS failures share a common pattern: dynamically injected content. Cookie consent banners that pop up after the page has loaded, advertisements that inject above existing content, and promotional bars that slide in from the top all cause CLS. The solution is to pre-reserve the space for any dynamically injected content (using CSS aspect ratio boxes or min-height properties) so that when the content loads, it fills a space that was already allocated rather than pushing existing content down. For business websites using chat widgets, the specific recommendation is to use CSS to reserve the bottom-right corner space that the widget will occupy, preventing a layout shift when it loads.
The Business Case: How Page Speed Directly Impacts Revenue
The data connecting page speed to business outcomes is some of the most thoroughly documented in digital marketing. Every tenth of a second matters, and the research evidence is consistent across industries and scales of business.
Key benchmarks from 2025–2026 research: a one-second delay in page load time results in a 7% reduction in conversions (Akamai) and 11% fewer page views. 53% of mobile users abandon a page that takes longer than 3 seconds to load — yet the average mobile page still takes 8.6 seconds (HTTP Archive). For B2B websites specifically, a site loading in one second has a conversion rate three times higher than one loading in five seconds and five times higher than one loading in ten seconds (Site Builder Report).
At a micro level, the numbers are equally striking. Amazon calculated that a 100ms delay costs 1% of sales — equivalent to $4.8 billion annually at their scale. Walmart found that every one-second improvement in page load time increased conversions by 2%. A 0.1-second improvement in speed increases conversions by 8.4% for retail and 10.1% for travel websites (Tenet research). These numbers are not from academic simulations — they are from large-scale production measurements on real websites with real revenue consequences.
For growing businesses, the implication is straightforward: website performance is a marketing investment with quantifiable returns. If your site currently loads in 4 seconds and you reduce it to 2 seconds, you can project a conversion rate improvement of 15–20% from that change alone, with no change to your advertising spend, your offer, or your content. That is the equivalent of a 15–20% increase in leads from the same traffic — representing substantial revenue at any scale. Read our guide on conversion rate optimisation for a framework that combines performance improvements with UX and copy optimisation for maximum impact.
The Technical Performance Stack: What to Optimise and How
Understanding Core Web Vitals is the diagnostic layer — the technical performance stack is the implementation layer. For most business websites, performance improvements fall into five categories: image optimisation, JavaScript management, server and hosting infrastructure, caching, and third-party script governance. Working through these systematically will address the root causes of poor LCP, INP, and CLS rather than chasing individual symptoms.
Image Optimisation: The Highest-Impact Performance Fix
Images are typically the largest assets on any webpage and the primary driver of LCP. The average web page weighs 2.3 MB (HTTP Archive), with images accounting for 50–70% of that weight on most sites. Optimising images is consistently the single highest-ROI performance task for most websites, and the gains are dramatic: converting images from JPEG/PNG to WebP format reduces file size by 25–35% with no perceptible quality loss. Converting to AVIF (the next-generation format supported by modern browsers) reduces size by 50% or more for appropriate images.
The four-part image optimisation framework for 2026 is: 1) Format — serve WebP (and AVIF where supported) with JPEG/PNG fallbacks; 2) Size — serve images at the exact pixel dimensions they will be displayed, not at full resolution; 3) Lazy loading — add loading="lazy" to all images not visible in the initial viewport, so they only load as users scroll toward them; 4) Priority — add fetchpriority="high" to your LCP image (usually the hero image above the fold) so the browser prioritises it above other resources. Together, these four steps can reduce total image weight by 50–70% and improve LCP by 30–50% on most sites.
A critical but often-missed detail: always set explicit width and height attributes on every image. Without these, the browser has no way to know how much space an image will occupy before it loads, which means it cannot reserve that space. The result is Cumulative Layout Shift — content moves around as images load in. Simply adding width and height attributes to all images is one of the most effective CLS fixes available and takes minutes to implement on most sites. Webflow handles this automatically when images are uploaded through the Designer, but custom code embeds and HTML embeds must include these attributes explicitly.
JavaScript Performance and the Main Thread
JavaScript is the primary cause of poor INP scores and a significant contributor to poor LCP. Every script that loads synchronously in the page head blocks all other rendering until it finishes downloading, parsing, and executing. On modern web pages with dozens of third-party scripts, this blocking time is a major performance bottleneck even when individual scripts are small.
The 2026 best practice framework for JavaScript performance centres on three principles: defer all non-critical scripts (add defer attribute to script tags so they load after HTML parsing), load third-party scripts asynchronously via Google Tag Manager rather than hard-coding them in the page head, and audit third-party script inventory regularly to remove tools that are no longer in use. A site with twenty analytics and marketing tags loading on every pageview — a typical scenario for established businesses that have accumulated tools over years — can have its INP improved by 50ms or more simply by removing three or four scripts that nobody is actively using.
For Webflow sites specifically, the webflow.js core library is loaded synchronously and cannot be removed. However, custom code, Lottie animations, and complex IX2 interaction triggers all add to main thread load. The Broworks case study of Webflow optimisation found that structured optimisation — removing unnecessary interactions, deferring third-party scripts, compressing images — delivered a 45% faster LCP and 60ms better INP on average, directly improving rankings and conversion rates.
CDN, Hosting, and Server Response Time
Time to First Byte (TTFB) — the time between a user's browser making a request and receiving the first byte of the response — is the foundation of all performance metrics. A high TTFB makes good LCP virtually impossible, because every millisecond of server delay is added directly to every page metric. Only 44% of websites achieve a good TTFB (under 800ms), making it statistically the biggest structural performance problem across the web.
The primary fix for TTFB is a Content Delivery Network (CDN). A CDN stores cached copies of your website on servers distributed around the world, so that when a visitor loads your page, the response comes from a server geographically close to them rather than from a single origin server. For a New Zealand business with visitors primarily in Australia and New Zealand, a CDN with edge nodes in Sydney and Auckland can reduce TTFB from 800ms to under 200ms — a 75% improvement that flows through to every other performance metric.
Webflow uses Fastly and AWS CloudFront as its CDN, which means all Webflow sites benefit from excellent global delivery out of the box. This is one of Webflow's most significant performance advantages over self-hosted WordPress: without Cloudflare or another CDN, a standard WordPress site on shared hosting will have TTFB of 500ms–2000ms, while Webflow consistently achieves 250–400ms. For businesses on WordPress, the Cloudflare APO (Automatic Platform Optimisation) plugin, which costs approximately $5/month, caches WordPress pages at Cloudflare's edge and can deliver sub-200ms TTFB globally — transforming WordPress performance to be competitive with Webflow. This comparison is covered in depth in our Webflow vs WordPress 2026 guide.
How to Audit Your Website's Core Web Vitals: The Free Tool Stack
Diagnosing Core Web Vitals issues requires using the right tools at the right layer. The distinction between lab data (simulated tests) and field data (real user measurements) is critical — they serve different diagnostic purposes and should be used in combination, never in isolation.
Google PageSpeed Insights (pagespeed.web.dev) is the best starting point for any performance audit. It provides both lab data (from Lighthouse running on a controlled server) and field data (from the CrUX dataset for URLs with sufficient traffic). The field data is what Google actually uses for ranking — if a URL does not have enough traffic to have CrUX data, PageSpeed Insights falls back to domain-level data. Run PageSpeed Insights on your homepage, your main service or product page, and your contact page — these are typically the highest-traffic, highest-conversion pages and represent your most important performance targets.
Google Search Console contains the Core Web Vitals report (under Experience > Core Web Vitals), which groups all URLs on your site into Good, Needs Improvement, and Poor categories based on field data. This report is essential for identifying which pages have performance issues and understanding whether those issues affect a meaningful number of visitors. URLs with insufficient traffic will not appear in this report — focus on the pages that do appear, as those have enough real-user data to be statistically meaningful.
Chrome DevTools Lighthouse (accessible via F12 in Chrome, then the Lighthouse tab) provides detailed lab diagnostics — it will identify your LCP element, show which resources are render-blocking, flag images that should be lazy-loaded, and give specific code-level recommendations. Use this for deep technical investigation after PageSpeed Insights identifies a problem page. The Lighthouse Performance score (0–100) is a lab metric and does not directly correspond to your CrUX field scores, but improving it typically improves field data too.
For ongoing monitoring, Google Search Console's CWV report should be reviewed weekly — especially after any site updates, plugin/script changes, or content migrations, which are common sources of performance regression. Setting up a simple monitoring process where someone reviews the CWV report each Monday takes five minutes and prevents the situation where a performance issue degrades rankings for weeks before it is noticed. Automated monitoring tools like Calibre, SpeedCurve, or WebPageTest can provide more granular tracking for larger sites or higher-stakes applications.
Core Web Vitals and Webflow: What You Need to Know
Webflow has a distinctive performance profile that differs meaningfully from both WordPress and custom-coded sites. Understanding these characteristics helps Webflow users make the right optimisation decisions rather than applying general advice that does not account for the platform's specifics.
Webflow's strengths are its global CDN (Fastly + AWS CloudFront providing reliable TTFB), automatic WebP image conversion and responsive images through the media uploader, and excellent out-of-box CLS (median 0.04 — the best of any CMS) due to pre-computed layouts that are visually stable during load. Webflow's CWV pass rate of 62% is well above the web average and above unoptimised WordPress (31%), though it falls short of well-optimised WordPress stacks (67%).
Webflow's main performance limitation is webflow.js — the core library that powers the Designer's interactions, form submissions, and other dynamic features. This script loads synchronously and adds 200–400ms to page rendering time. For sites with heavy interactions (complex scroll animations, multi-step transitions), this delay compounds further, pushing LCP above the 2.5-second threshold and INP above 200ms. The specific optimisation guidance for Webflow in 2026 includes: minimising IX2 interactions to only what is visible above the fold on initial load, loading all custom code via the page's Footer Code section (not Header Code) to prevent render-blocking, and deferring all third-party scripts through Google Tag Manager.
Webflow's auto-optimised image handling is one of its strongest features: any image uploaded through the Webflow Designer is automatically served as WebP, resized for different viewports, and delivered via CDN. The main trap is custom HTML embeds that reference images externally — these bypass Webflow's optimisation pipeline and must be manually optimised with the correct format, srcset, lazy-loading, and dimension attributes. See our full guide on Webflow vs WordPress for a complete comparison of the performance characteristics of each platform.
The 2026 Technical SEO Landscape: Beyond Core Web Vitals
Core Web Vitals are Google's most explicitly defined performance ranking signals, but the broader technical SEO landscape in 2026 has evolved significantly. Several changes are directly relevant to website performance and discoverability.
Google's December 2025 rendering update clarified that pages returning non-200 HTTP status codes (404, 503, etc.) may be excluded from the rendering queue entirely. This means that broken pages — even ones that display a nice custom error message — may not be crawled or rendered by Google, with direct implications for link equity and indexability. Auditing your site for 4xx and 5xx errors in Google Search Console should be a monthly task, not an occasional one.
The rise of AI-powered search (Google AI Overviews, Bing Copilot) has added a new dimension to technical SEO. Structured data (Schema markup) has become the primary language through which AI assistants understand and cite website content. Pages with well-implemented Schema are significantly more likely to be quoted in AI Overviews and AI-generated responses. For business websites, the most impactful Schema types are: LocalBusiness (for service businesses with geographic presence), FAQPage (for FAQ sections), Service (for individual service descriptions), and Organization (for the company overview). This intersection of technical SEO and generative engine optimisation (GEO) is covered in depth in our SEO and GEO Strategy guide.
Mobile-first indexing — which has been Google's default since 2018 but still catches many businesses off guard — means that the mobile version of your website is what Google indexes and ranks. If your mobile site has less content, slower performance, or different structured data than your desktop version, your rankings will be based on the mobile version's quality. For any site that has different content on mobile vs. desktop (often a legacy of responsive design shortcuts taken years ago), audit the mobile experience specifically and ensure it contains all the content and Schema that your desktop version does.
| Fix | Affects | Effort | Impact | Notes |
|---|
Putting It All Together: A 90-Day Performance Improvement Plan
Understanding Core Web Vitals and technical performance in theory is useful; having a prioritised action plan is what actually moves the metrics. For most business websites, the following 90-day structure delivers the most significant measurable improvement in Core Web Vitals, search rankings, and conversion rate.
Days 1–14 (Quick Wins): Run PageSpeed Insights on your top 10 pages and document all identified issues. Audit and compress all above-the-fold images — convert to WebP, target under 80KB for hero images, add fetchpriority="high" to the LCP element. Add loading="lazy" to all below-fold images. Check that all images have explicit width and height attributes. Enable Cloudflare CDN if not already in place (the free tier is sufficient for most business websites). Review Google Search Console's Core Web Vitals report for any Poor URLs and prioritise those pages for further investigation. These actions typically cost one to two days of developer time and can deliver 20–40% LCP improvement and significant CLS elimination.
Days 15–45 (Script and Interaction Audit): Inventory all third-party scripts running on the site (a browser tool like Chrome's Coverage tab or GTM Tag Assistant shows this). Migrate any scripts hard-coded in the site header to Google Tag Manager with proper async/defer settings. Audit Webflow IX2 interactions and remove or simplify any that are not essential for conversion or brand communication. Test INP on key pages using Chrome DevTools performance profiler — look for interactions with response times over 200ms and investigate the JavaScript tasks that are delaying them.
Days 46–90 (SEO Technical Foundations): Implement or audit structured data on all key page types — at minimum, Organization, Service pages, and FAQPage on the FAQ section. Review robots.txt and sitemap for crawl issues. Check for pages with missing or duplicate canonical tags. If the site has been live for more than two years, conduct a content audit to identify thin or duplicate content pages that may be diluting crawl budget and page authority. Set up ongoing CWV monitoring (Google Search Console plus a tool like SpeedCurve or monthly PageSpeed Insights spot checks) to catch regressions before they compound into ranking drops.
Ready to get a professional assessment of your website's performance? Our Website Build Scoping tool helps you understand whether your current site can be optimised to meet 2026 standards, or whether a rebuild on a performance-first platform like Webflow is the more cost-effective path. Scope your website project with Involve Digital — we will assess your current performance gaps and recommend the right approach for your goals and budget.
Get Started Using The Form Below
Website performance in 2026 is a compounding advantage — businesses that invest in Core Web Vitals today receive better rankings, which drive more traffic, which at a higher conversion rate generates more revenue, which funds further website investment. The competitive moat created by a genuinely fast, technically sound website grows over time. For the complete picture of what makes a business website perform, return to the Website Design and Build guide, and explore our article on website analytics and GA4 setup to ensure you are measuring the impact of every performance improvement you make.
Questions